How to Set ggplot Facets Coords Individually
07 May 2019 —If you’ve been visualizing different types of data for long enough, you’re basically guaranteed to run up against the bounds of what’s easy/possible to do in whatever software you use.
I almost exclusively use R’s ggplot2 to plot stuff, and I’ve found multiple times that there are just some things that you can’t do and that the development team doesn’t plan on implementing anytime soon.
Here, I’ll share some code to make the impossible possible: setting different scales / coordinates for individual facets.
The issue
Don’t get me wrong—ggplot2 is amazing, and I understand why they want to keep things simple—but unless you’re willing to get into the underlying grid/gtable code (a.k.a. “Grob’s country”), you’re probably out of luck. For example, many people have wanted to specify the scales of different facet panels individually (i.e., when using facet_wrap or facet_grid) for a very long time. Most often their issues can be addressed by setting scales=free, but sometimes they want something more exotic, in which case often using geom_blank() in some kind of hacky way is the easiest solution.
But sometimes geom_blank doesn’t work—like in my case, where I wanted to “zoom in” on different areas of different facets without removing any data. In ggplot2, this can really only be accomplished with a Coord object (e.g., coord_cartesian()), which means scale-based solutions like facetscales won’t work.
A look at the data
Specifically, I wanted to plot certain trends with crazy huge asymmetric confidence intervals, but I wanted the confidence intervals to be free to go “off-panel” so they wouldn’t squish the trend data down to a flat line.1
Here’s kind of what the data looked like:
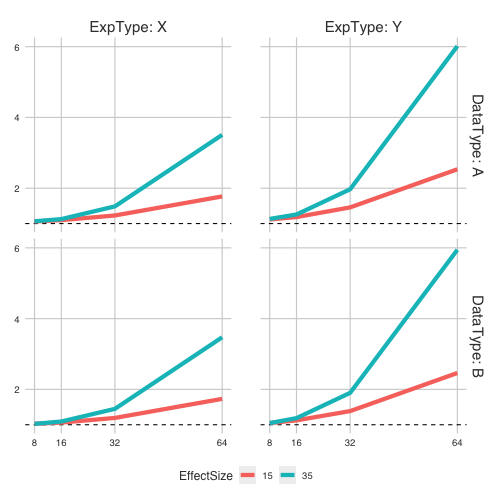
Now here’s what it looked like with the confidence intervals:
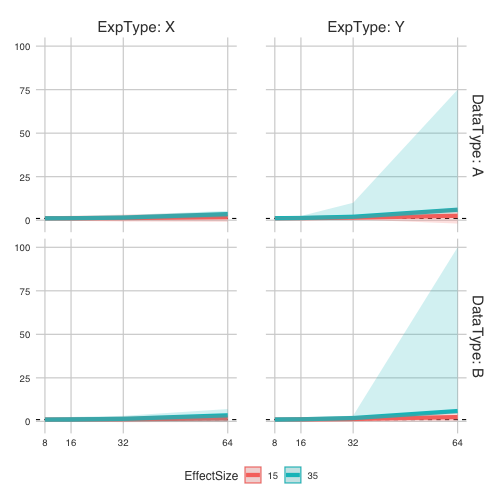
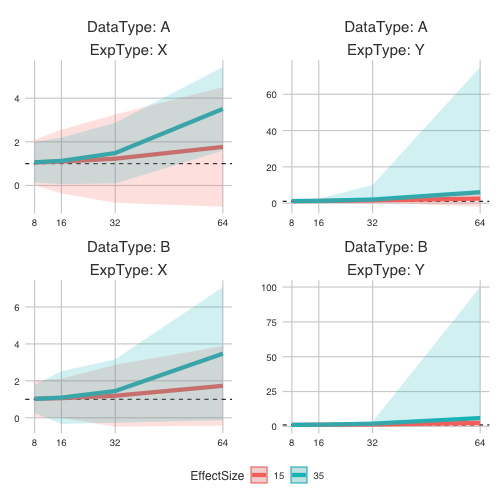
Notice that even with facet_wrap and scales = "free", the problem isn’t really solved:
The lame hacky solution
First, I should say that everything I’m doing requires ggplot2 v3.1.0 and up. Older versions of ggplot22 do NOT work!
Hacking together a few answers from Stack Overflow, I realized that I could pry into the structure of what ggplot2 outputs and manipulate that manually. Here’s what I ended up doing:
old_plot <- data %>%
  ggplot(...) +
  facet_wrap(DataType ~ ExpType, scales="free") +
  geom_line()

new_plot <- old_plot +
  geom_ribbon(aes(ymax=upper, ymin=lower))
old_plot_data <- ggplot_build(old_plot)
new_plot_data <- ggplot_build(new_plot)
new_plot_data$layout$panel_params <- old_plot_data$layout$panel_params
plot(ggplot_gtable(new_plot_data))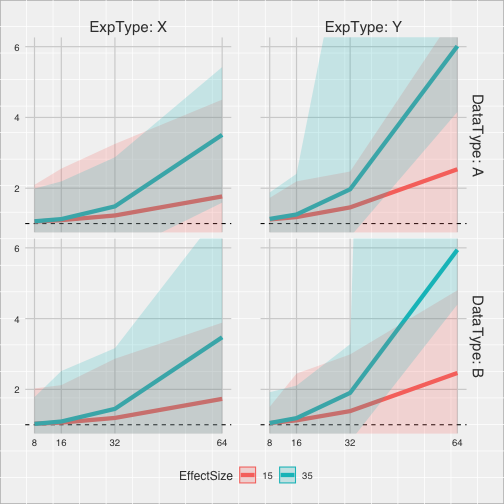
But I disliked this solution for multiple reasons, primarily because once you “build” a ggplot object or turn it into a g_table, you can’t change it back. Meaning that you can’t add layers or geoms to it very easily.
The cool hacky solution
I’ll spare the reader my voyage of discovery, but in the end I was faced with the following problem:
- The following process cannot be modified or extended without a major overhaul, and it all takes place in a
Layoutobject that is built whenever the plot is displayed - The
layout$panel_paramsthat controls the x and y ranges for the facets is set by mapping a function from theCoordobject across a list of facet scales - The
Coordobject essentially has no explicit information about the identity of the facets, and the function that sets the ranges can’t tell which facet it is being applied to
The last issue seemed to be the worst for me. If I wanted to apply arbitrary coordinates to arbitrary facets, how could I do that without knowing which facet I was applying it to? I came up with the dumb idea of just counting how many times the function had been applied—taking advantage of the statefulness/mutability of the ggproto objects—and getting the current panel identity from that.
Counting the panels
The function in CoordCartesian is this:
setup_panel_params <- function (self, scale_x, scale_y, params = list())
{
    train_cartesian <- function(scale, limits, name) {
        range <- scale_range(scale, limits, self$expand)
        out <- scale$break_info(range)
        out$arrange <- scale$axis_order()
        names(out) <- paste(name, names(out), sep = ".")
        out
    }
    c(train_cartesian(scale_x, self$limits$x, "x"), train_cartesian(scale_y,
        self$limits$y, "y"))
}
And the function in my new UniquePanelsCoord is as follows, where self$panel_counter, self$panel_ranges, and self$num_of_panels are custom variables of the UniquePanelsCoord class. self$num_of_panels is used to reset self$panel_counter whenever setup_panel_params applies to all of the facets. If it didn’t, the second time you displayed the plot self$panel_counter would move out of bounds past the last index of self$panel_ranges.
setup_panel_params = function(self, scale_x, scale_y, params = list()) {
    if (!is.null(self$panel_ranges) & length(self$panel_ranges) != self$num_of_panels)
      stop("Number of panel ranges does not equal the number supplied")

    train_cartesian <- function(scale, limits, name, given_range = NULL) {
      if (is.null(given_range))
        range <- ggplot2:::scale_range(scale, limits, self$expand)
      else
        range <- given_range

      out <- scale$break_info(range)
      out$arrange <- scale$axis_order()
      names(out) <- paste(name, names(out), sep = ".")
      out
    }

    cur_panel_ranges <- self$panel_ranges[[self$panel_counter]]
    if (self$panel_counter < self$num_of_panels)
      self$panel_counter <- self$panel_counter + 1
    else
      self$panel_counter <- 1

    c(train_cartesian(scale_x, self$limits$x, "x", cur_panel_ranges$x),
      train_cartesian(scale_y, self$limits$y, "y", cur_panel_ranges$y))
  }
Notice that, unfortunately, my custom setup_panel_params() function relies on the unexported ggplot2 function, scale_range(). It’s not ideal, but I think it should relatively stable. In the worst-case scenario you could just hard-code it in, but that doesn’t seem necessary.
Sneaking a peak at the panel information
How does a Coord get the number of facets and the list of panel ranges one wants to use? Well, it turns out that the Layout object lets the Coord object manipulate if it needs to be calling the Coord’s setup_layout() function. Looking through ggplot2’s source code, I never found this actually implemented, but I suppose they wanted to give future developers the option to if they wanted to.
Taking advantage of the fact that at one point the Coord objects gets to look at the data in Layout, I used this function to modify the Coord object
instead of modifying the layout, getting the number of facets from its data.
setup_layout = function(self, layout, params) {
    self$num_of_panels <- length(unique(layout$PANEL))
    self$panel_counter <- 1
    layout
}
The list of panel ranges can just be passed in when a new instance of UniquePanelCoords is created:
coord_panel_ranges <- function(panel_ranges, expand = TRUE,
                               default = FALSE, clip = "on") {
  ggplot2::ggproto(NULL, UniquePanelCoords, panel_ranges = panel_ranges,
          expand = expand, default = default, clip = clip)
}
Example
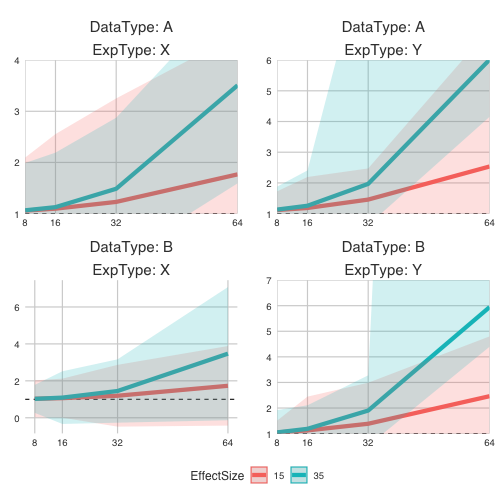
Here’s an example of it in action. You can see that putting in empty lists for a panel’s range will make it revert back to the default range. Also, keep in mind that if you change the ranges while using facet_grid(), you run the risk of creating a misleading plot since the axis differences might not be marked.
data %>%
  ggplot(aes(x=Nsubjects, y = Odds, color=EffectSize)) +
  facet_wrap(DataType ~ ExpType, labeller = label_both, scales="free") +
  geom_line(size=2) +
  geom_ribbon(aes(ymax=Upper, ymin=Lower, fill=EffectSize, color=NULL), alpha=0.2) +
  coord_panel_ranges(panel_ranges = list(
    list(x=c(8,64), y=c(1,4)), # Panel 1
    list(x=c(8,64), y=c(1,6)), # Panel 2
    list(NULL),                # Panel 3, an empty list falls back on the default values
    list(x=c(8,64), y=c(1,7))  # Panel 4
  ))
I think the code is basic enough that it can be extended pretty easily. Hopefully this helps!
Code
UniquePanelCoords <- ggplot2::ggproto(
  "UniquePanelCoords", ggplot2::CoordCartesian,

  num_of_panels = 1,
  panel_counter = 1,
  panel_ranges = NULL,

  setup_layout = function(self, layout, params) {
    self$num_of_panels <- length(unique(layout$PANEL))
    self$panel_counter <- 1
    layout
  },

  setup_panel_params =  function(self, scale_x, scale_y, params = list()) {
    if (!is.null(self$panel_ranges) & length(self$panel_ranges) != self$num_of_panels)
      stop("Number of panel ranges does not equal the number supplied")

    train_cartesian <- function(scale, limits, name, given_range = NULL) {
      if (is.null(given_range))
        range <- ggplot2:::scale_range(scale, limits, self$expand)
      else
        range <- given_range

      out <- scale$break_info(range)
      out$arrange <- scale$axis_order()
      names(out) <- paste(name, names(out), sep = ".")
      out
    }

    cur_panel_ranges <- self$panel_ranges[[self$panel_counter]]
    if (self$panel_counter < self$num_of_panels)
      self$panel_counter <- self$panel_counter + 1
    else
      self$panel_counter <- 1

    c(train_cartesian(scale_x, self$limits$x, "x", cur_panel_ranges$x),
      train_cartesian(scale_y, self$limits$y, "y", cur_panel_ranges$y))
  }
)

coord_panel_ranges <- function(panel_ranges, expand = TRUE, default = FALSE, clip = "on")
{
  ggplot2::ggproto(NULL, UniquePanelCoords, panel_ranges = panel_ranges,
          expand = expand, default = default, clip = clip)
}
Source Code:
The source code is on my GitHub as a gist here. It’s definitely just a start though, and I encourage anyone to take it and polish it up and flesh it out. The way panel ranges are handed in is pretty cumbersome currently, and it could be easily extended so that it takes in arbitrary scales as well! It would probably also be easy to extract the panel ranges from a previous plot and automatically apply them to a new one.
It’s also not really tested much, so feel free to drop me a line on what you think, or if you spot any bugs!
Footnotes:
-
Trust me, I know what I’m doing here. The trends were odds ratios of bounded data and when both conditions were ~0.0001% away from their upper bounds, the confidence intervals are basically there to highlight issues with those comparisons. ↩